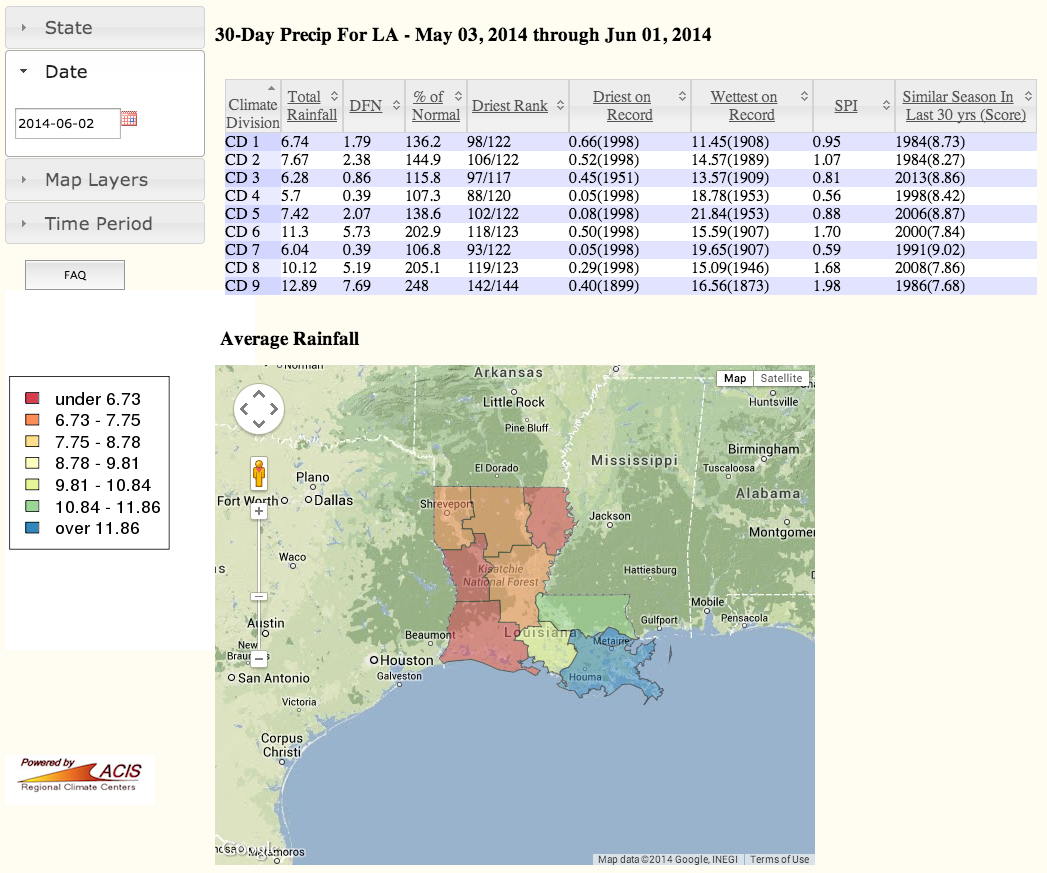
This tool displays information on drought severity and the amount of precipitation needed to get out of drought. Users can view precipitation statistics (e.g., rainfall total, departure from normal, % of normal, and standard precipitation index) by climate division for any state in the SCIPP region. Users can also select an end date and the time period (30-day period is currently available) for which they would like to view the statistics. Data are provided in table and map formats, and the normals are based on 1981-2010 averages.