Severe Thunderstorm Winds
Data Limitations
Population and temporal biases (i.e., greater number of reports in recent decades), a limited number of weather stations that record wind speed, and the fact that severe thunderstorm winds can be very localized, mean that data are not of sufficient quality to robustly determine whether there have been trends over a long period of time (e.g., 100+ years).
Definition and Description
High winds are defined as sustained non-convective wind speeds of 40 mph or greater lasting for 1 hour or longer, or gusts of 58 mph or greater for any duration.
Severe thunderstorm winds are winds of 58 mph or greater when convection (i.e., thunderstorm) is present.
High winds can occur with thunderstorms, but also with frontal passages and gradients between areas of high and low pressure. There are several types of wind events.
- Straight-line winds are thunderstorm winds that do not have rotation and are different from tornadic winds.
- Downdraft winds can also be damaging and are a small column of air that rapidly sinks toward the ground.
- Downbursts describe wind events that are caused by a strong downdraft within a thunderstorm.
- Microbursts are small concentrated downbursts that produce an outward burst of strong winds at or near the surface.
Wind speeds and the effects can be measured by the Beaufort Wind Scale (NWS 2024), which ranges from 0 (calm winds) to 12 (hurricane-force winds).
Historical Data
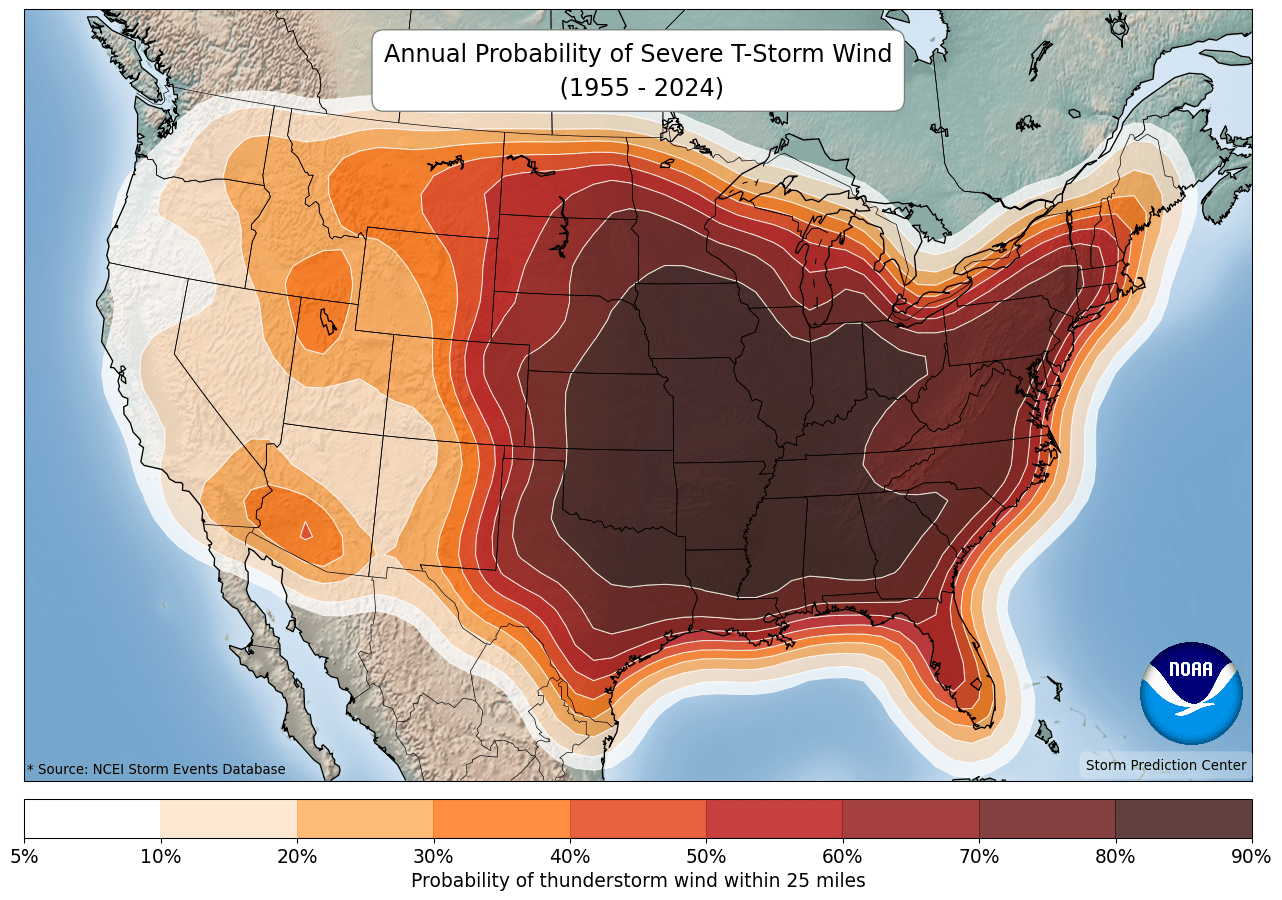
SPC Data Viewer - Thunderstorm Wind Climatology
(1955-2024)NOAA/NWS Storm Prediction CenterThis tool provides a severe thunderstorm wind climatology for hourly, daily, monthly, and yearly time scales. It can be used to assess the time of day and time of year with the highest probability of thunderstorm winds. The tool also provides a climatology for other hazards (e.g., any severe storm, lightning, hail, tornado, fire).
1. Within the Hazard drop-down menu, select Wind. 2. Within the Climatology Interval menu, select the option you are interested in. For all options other than Yearly, there is a horizontal scroll bar under the map to change the map view to each hour, day, or month of the year. Note: Read the title and colorbar for each selection, as there are differences in what is shown. For hourly selections, note that the map title and scroll bar show hours in UTC format. 3. Within the Climatology Length menu, select All Data to view a climatology since 1955 or Last 30 Years to view the most recent 30-year period. 4. Within the Threshold menu, select a wind criteria or leave as All T-storm Wind. 5. Under Map Overlays, check any layers of interest. 6. Click your area of interest on the map to view the probability of thunderstorm wind for your selection. 7. Use the download feature to receive a clean output map for the full U.S. with a legend. 8. Read more about the probability calculations and map information in the About section. Note for hourly options: The pop-up box shows local time, unlike the map title.
Severe T-Storm Wind Reports
Wind: (1955-present) Southern Regional Climate CenterThis interactive tool shows you the historical record for individual severe thunderstorm wind reports (gust of 57 mph or greater) in your area. It can be used to determine severe thunderstorm wind events that have impacted your area or nearby.
1. On the left side of the screen, click on Search within Radius. 2. Choose the diameter of the area of which you want to investigate (25 or 50 miles). 3. Select Wind (de-select other hazards). 4. Pan, zoom, and then click on the map area of interest. 5. Reports are displayed on the map and in two tables below the map. 6. Map: Mouse over individual storm reports for details. 7. Tables: There are two tables, Recent Storm Reports and Historical Storm Reports. Click on column header to sort by column of interest. For example, to view the dates in which the highest wind occurred, click on the Scale column headers to sort by the highest wind value.

Severe T-Storm Watch Climatology Map
(2004-2023) NOAA/National Weather Service Storm Prediction CenterThis map shows a 20-year climatology of severe thunderstorm watches. From this map, you can get a sense of the approximate number of days each year you can expect to have a severe thunderstorm watch issued for your county(ies).
1. Under the Storm Prediction Center WCM Page banner near the top of the page, click on the Watch Frequency Maps link. 2. Scroll down a bit until you see 20y SPC Watch Climatology. 3. Click on the Average number of severe thunderstorm watches per year image to view it in larger form. Note: this WCM page contains a lot of other statistics about the hail, severe thunderstorm, and tornado products that come out of the NWS Storm Prediction Center if you are interested in digging deeper into the data.

Climate Change Trends
Damaging winds in Texas are associated with severe thunderstorms, as well as hurricanes. More favorable environments for severe thunderstorms are expected, especially during the peak storm season (March-May), so associated increases in severe wind occurrences are projected. It is not known, however, whether the favorable environments will reach their potential of producing damaging winds (Kossin et al. 2017). Historically, severe thunderstorm winds have occurred most often in northern and northeast Texas.