
Hail
Data Limitations
Hail data are not of sufficient quality to robustly determine historical trends and is of poorer quality than even the tornado dataset. This can be attributed to the increases in non-meteorological factors such as population and storm spotter coverage over time, as well as the uncertainty in reported hail size. However, the recent acknowledgement to assess the number of hail days as a way to investigate frequency instead of individual hail reports has mitigated some of the biases.
Definition and Description
Showery precipitation in the form of irregular pellets or balls of ice more than 5mm (0.2 inches) in diameter, falling from a cumulonimbus cloud (NWS 2009).
Hail forms by the collision of supercooled drops – raindrops that are still liquid even though the air around them is below freezing. The hailstone grows, supported by the updraft, until it is too heavy to remain aloft. Stronger updrafts generally produce larger hail size. Because obtaining large hail sizes requires a strong updraft, the timing of large hail is related to the lifecycle of large cumulonimbus clouds, which peak in intensity during late afternoon and evening hours. Updrafts may also be supported by vertical motion along a boundary, such as a front or mountains.
Hail severity is rated by the diameter of the largest hailstones in a storm. Hail of 1-inch diameter or greater is considered severe.
Historical Data
SPC Data Viewer - Hail Climatology
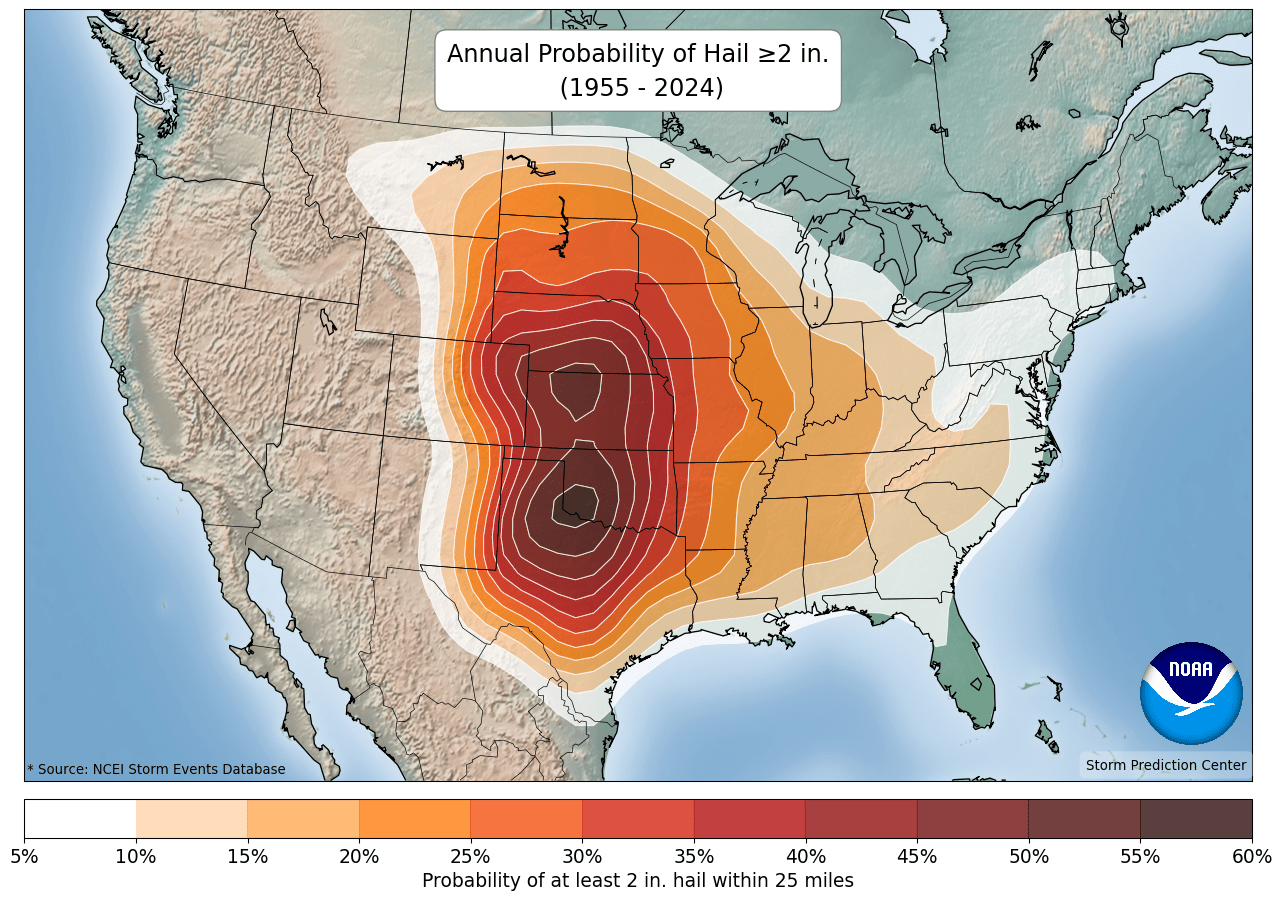
(1955-2024) NOAA/NWS Storm Prediction CenterThis tool provides a hail climatology for hourly, daily, monthly, and yearly time scales. It can be used to assess the time of day and time of year with the highest probability of hail. The tool also provides a climatology for other hazards (e.g., any severe storm, lightning, wind, tornado, fire).
1. Within the Hazard drop-down menu, select Hail. 2. Within the Climatology Interval menu, select the option you are interested in. For all options other than Yearly, there is a horizontal scroll bar under the map to change the map view to each hour, day, or month of the year. Note: Read the title and colorbar for each selection, as there are differences in what is shown. For hourly selections, note that the map title and scroll bar show hours in UTC format. 3. Within the Climatology Length menu, select All Data to view a climatology since 1955 or Last 30 Years to view the most recent 30-year period. 4. Within the Threshold menu, select a hail size or leave as All Data. 5. Under Map Overlays, check any layers of interest. 6. Click your area of interest on the map to view the probability of hail for your selection. 7. Use the download feature to receive a clean output map for the full U.S. with a legend. 8. Read more about the probability calculations and map information in the About section. Note for hourly options: The pop-up box shows local time, unlike the map title.
Storm Reports - Severe Hail
Hail: (1955-present) Southern Regional Climate CenterThis interactive tool shows you the historical record for individual severe hail reports in your area within a 25 or 50 mile radius. It is especially useful to determine the largest hail reported.
1. On left side of screen, click on Search with Radius. 2. Choose the diameter of the area of which you want to investigate (25 or 50 miles). 3. Select Hail (de-select Tornado and Wind). 4. Pan, zoom, and then click on the map area of interest. 5. Reports are displayed on the map and in two tables below the map.
Map: Mouse over individual storm reports for details.
Tables: There are two tables, Recent Storm Data and Historical Storm Data. Click on column header to sort by column of interest. For example, to view the dates in which the largest hail occurred, click on the Scale column headers to sort by the largest hail values.

Storm Events Database
Hail: (1955-present) NOAA National Centers for Environmental InformationThis interactive tool shows you the historical record for individual severe hail reports by county. It can be used to determine hail events that have impacted your area or close to your area.
1. On the bottom left, under Select State or Area, choose Arkansas → Search 2. From top to bottom, select a specific Begin and End Date, as well as County of interest. 3. Under Event Type(s), select Hail. 4. Under Advanced Search and Filter Options → Hail Event Type Filter, select hail size of interest. 5. Press Search. Summary results are presented in a table. Note: This tool can be used to analyze a variety of additional hazards with various time periods, and hail data goes as far back as 1955. This database is likely incomplete and does not account for all hail events.

Climate Change Trends
Hail is commonly associated with severe thunderstorms. Climate models project an increase in the frequency and intensity of severe thunderstorms, and events with large hail are projected to increase (Kossin et al. 2017). At the same time, models project an overall decrease in the number of days with hail per year (Brimelow et al. 2017). Confidence in the projections is currently low, however, due to the isolated and sporadic nature of hail events and limited comprehensive datasets which make it difficult to track long-term trends (Wuebbles et al. 2017a).